Yanzi Insights is an analytics and dashboard tool that provides plug-and-play business insights based on collected data. Insights include analytics for occupancy, health, and standards compliance. Live dashboards engage building occupants and increase building value.
In the post-Covid world, buildings will be seen as a first line of defense against disease. A healthy building will go from a “nice to have” to a competitive, “must have.”
Yanzi is currently receiving many questions and requests in regards to how we can help with ensuring a safe return to the workplace. We have decided to make a number of features available for free until august.
Insights allow you to protect the health of your most important assets — your employees.
Made complete with Yanzi Insights.
Live maps
Your data. In real-time.
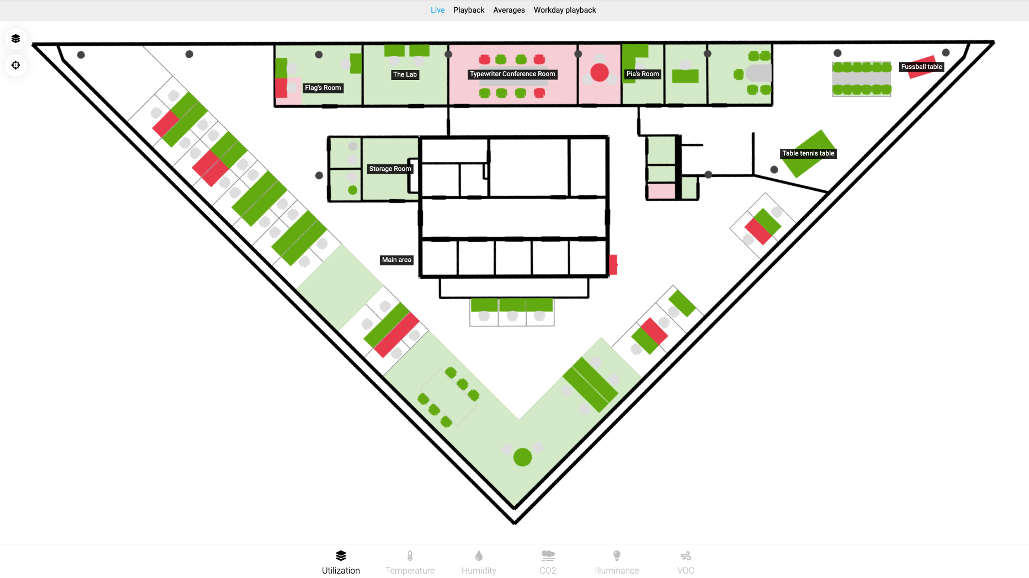
Find available workspaces or collaboration areas, visualize indoor air quality in real-time, or go back in time and investigate historical data.
Maps can be used to visualize data such as utilization, temperature, humidity, CO2, Illuminance and VOC.
Powerful analytics
Actionable. Data.
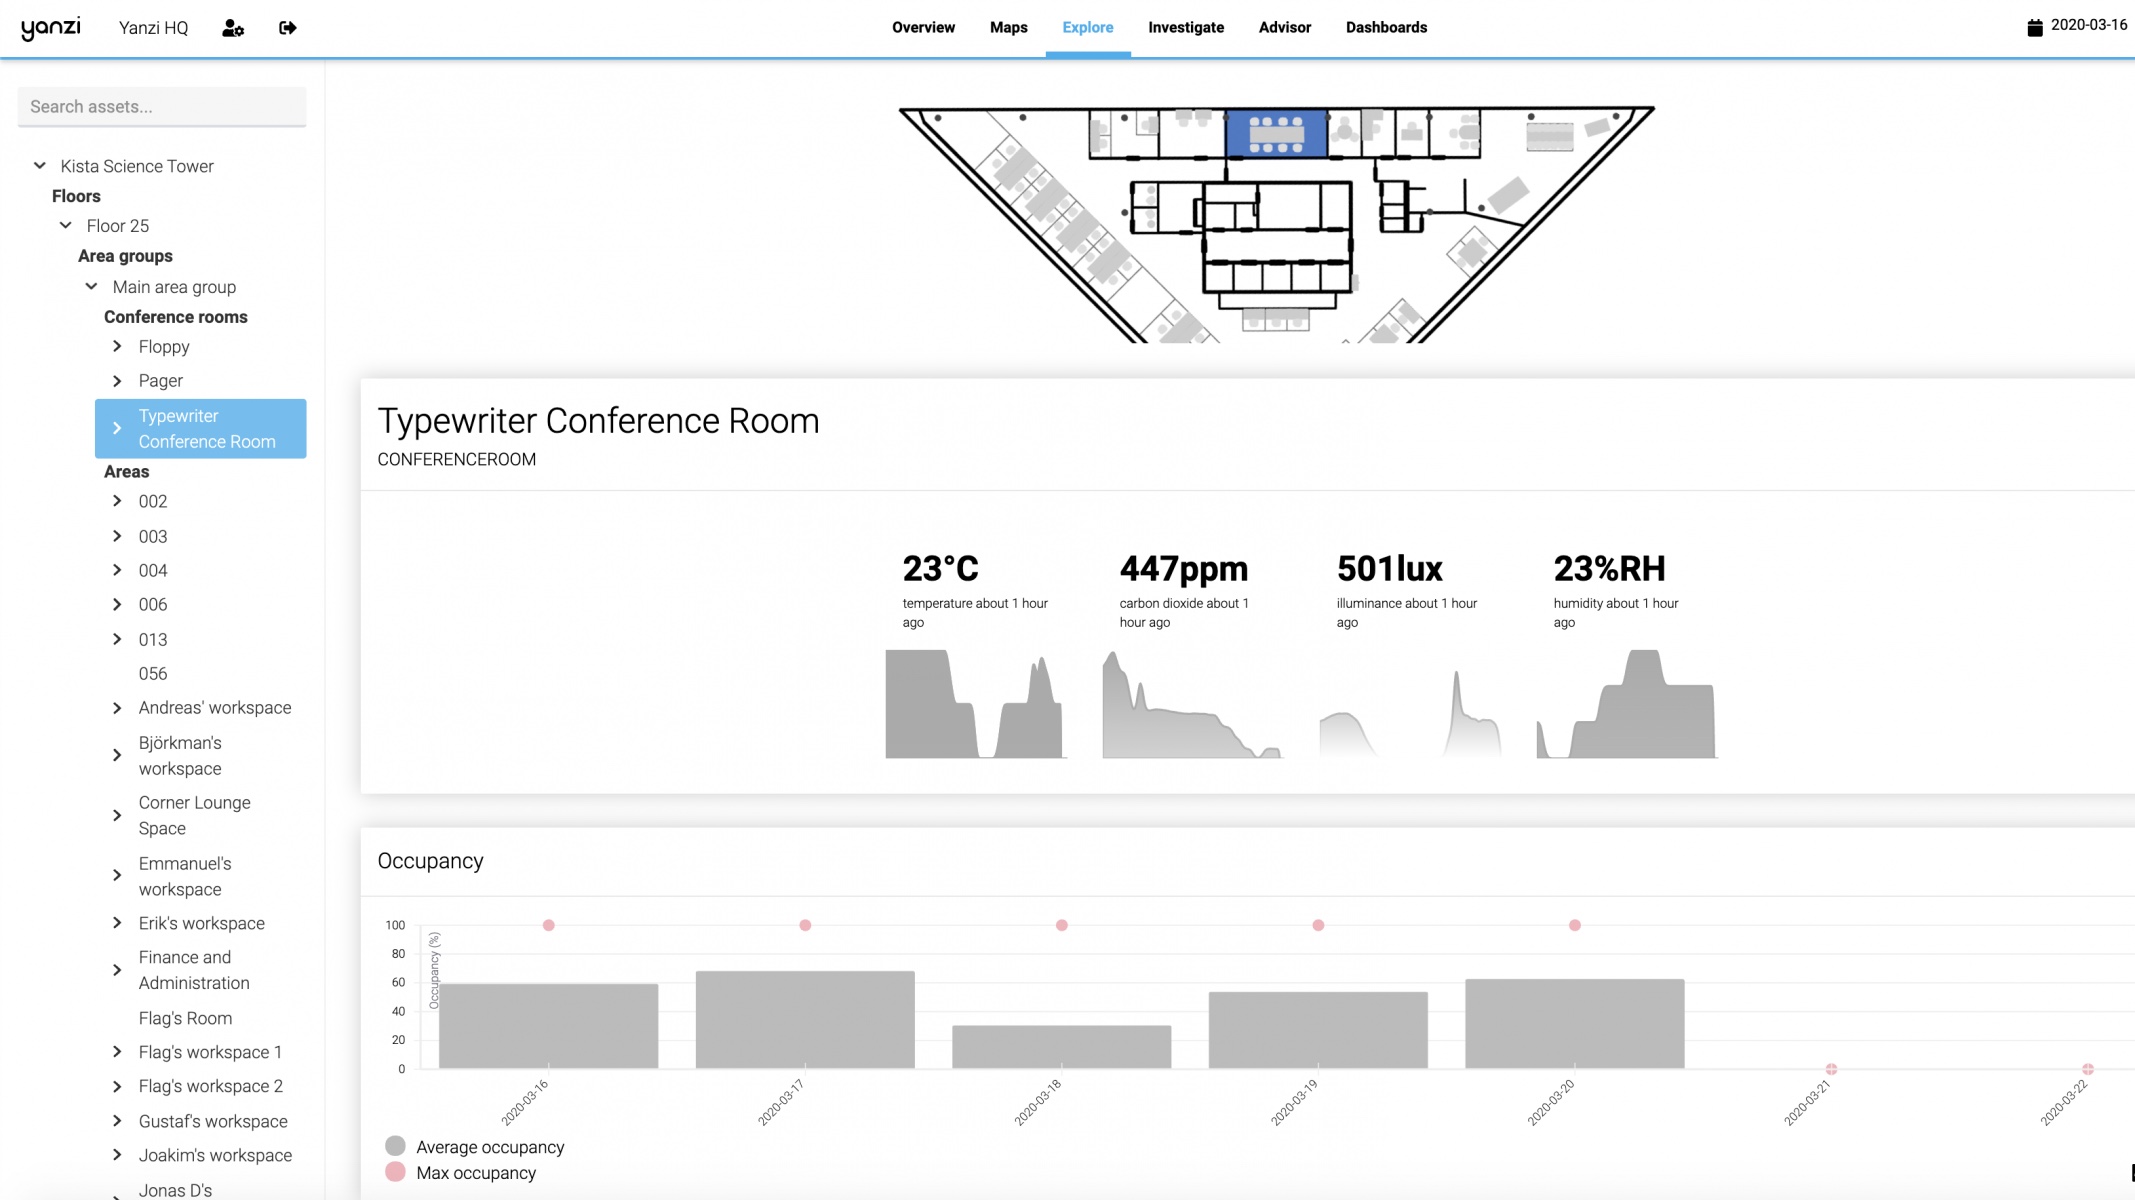
Explore your building, nail down underperforming assets and compare trends over time.
Need to compile a report or take your analysis further with your favorite data cruncher? No problem - graphs can easily be exported to images or CSV!
Dashboard & kiosk mode
Occupant. Engagement.
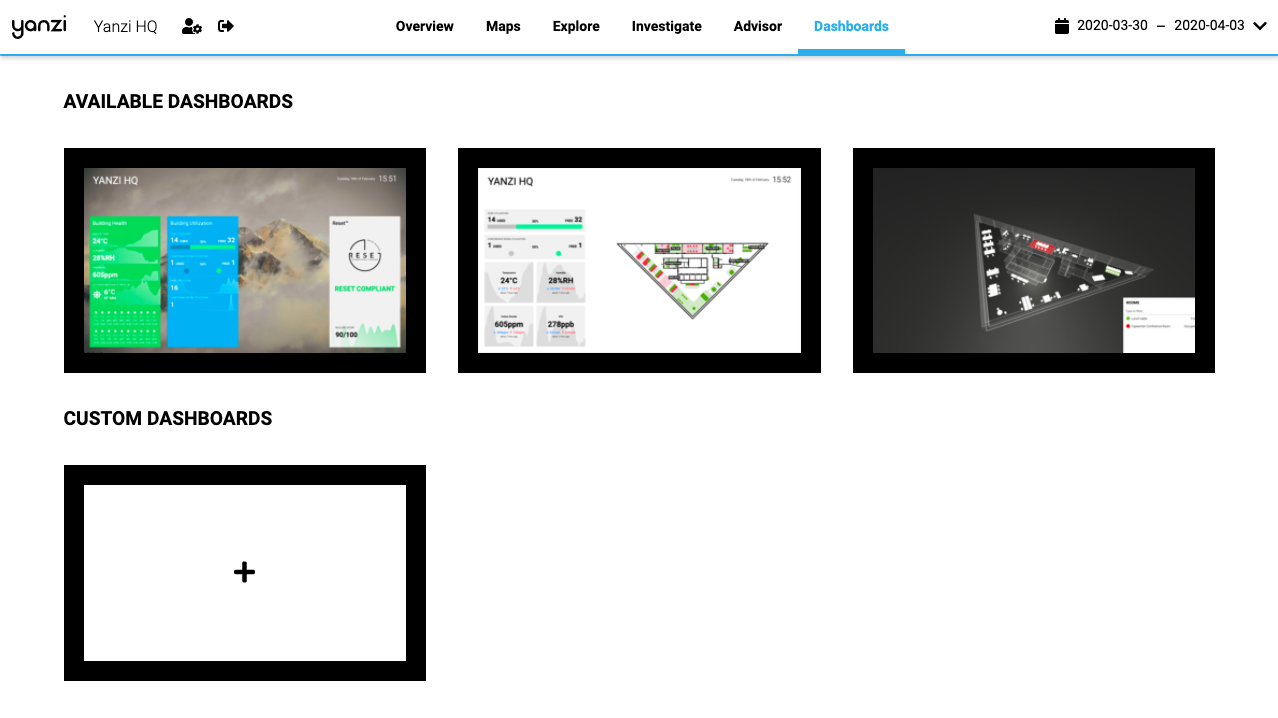
Use our dashboard templates and be up and running minutes after installation. You'll get interactive high-performance dashboards that run on any modern browser.
Dashboard editor
Fully customizable.
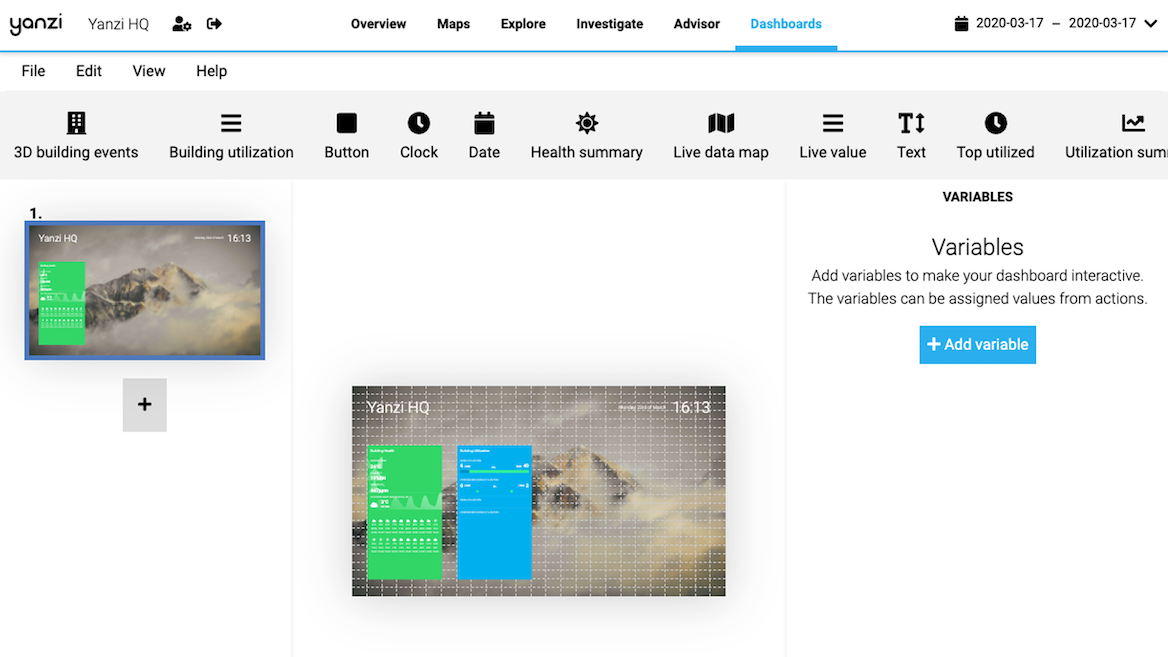
Every use case is unique. Insights therefore includes a powerful dashboard editor that enables you to put together the information that matters to your tenants.